
Conjoint Analysis Applications in Feature Prioritization
Forced trade-offs reveal what customers actually value, not what they claim to.
Ask most product managers how a feature made it onto the roadmap. The honest answer involves a survey where customers rated everything "important" or "very important," a sales team that wanted it for one deal, and a founder's hunch. Conjoint analysis exists to replace that process with something that actually costs the respondent something: a choice. Instead of asking people to rate features in isolation, it forces them to pick between complete product alternatives, each with different combinations of features and price, so what gets measured is what they'd give up, not what they'd praise.
That distinction shapes how much the answer can be trusted, since rating scales cost nothing to answer generously. Rating scales cost nothing to answer generously. A respondent asked "how important is offline mode to you?" has no reason not to say "very important," because saying so carries no consequence, no budget line, and no competing feature they'd have to sacrifice to get it. Social desirability does the rest: people want to sound like they care about security, sustainability, and advanced integrations, whether or not they'd ever pay a cent more for them. The result, over and over, is a roadmap driven by whoever argued loudest in the planning meeting, or by whatever tested well on a survey that never asked anyone to sacrifice anything. Teams ship features with high internal confidence and watch adoption stall. Pricing gets set without anyone knowing which capability moved the purchase decision.
What conjoint analysis does: forced choices, part-worth utilities, and why that changes what you learn
The mechanism is simple to describe and harder to design well. Respondents see a series of product cards, each one varying across several attributes at once (price, feature set, support level, whatever the study is testing), and they pick the one they'd buy. They can't say "I want the premium interface and the basic price." Every card is a bundle, and every choice is a trade-off, whether the respondent thinks about it that way or not.
That's the whole point. Each choice a person makes implies something about how they weigh one attribute against another, and across enough respondents and enough choice tasks, that pattern of choices gets converted into a number for every single feature level in the study. Statisticians call this a part-worth utility: a score showing how much a specific attribute level (say, "advanced integration" versus "basic integration") adds to or subtracts from a product's overall appeal, relative to the other levels tested.
From those utilities, a few things fall out almost automatically. Attribute importance shows how much a given feature swings preference from its worst level to its best. Willingness to pay converts a feature's utility into dollar terms by comparing it against the utility tied to a known price increment. And market simulation lets a team build hypothetical product configurations and estimate what share of preference each one would capture against the others, before anything gets built.
The four conjoint variants and which product situations each fits
Choice-Based Conjoint (CBC) is the version most product and pricing teams reach for first, and for good reason. It shows complete product concepts side by side and asks respondents to pick one, the same way they'd choose between products on a shelf or in a pricing table. It's the right tool when the question is about configuring and pricing a single product line.
Adaptive Conjoint (ACBC) changes the questionnaire in real time based on how each person has answered so far, narrowing in on tighter utility estimates as the interview goes. In complex studies with a lot of attributes, ACBC lets researchers use a smaller sample than standard CBC would need. The tradeoff is that adaptive designs complicate segmentation analysis afterward, since not every respondent saw the same set of comparisons.
Brand-specific, or alternative-specific, conjoint puts named competitor products into the choice task instead of a generic unbranded one. That's the right call when real competitor SKUs already exist in the market and feature sets differ meaningfully brand to brand. It mimics the actual shelf, or the actual search results page, rather than an abstract comparison.
Menu-based conjoint takes a different shape entirely: respondents build their own bundle, picking individual features at stated prices the way they'd configure a car or assemble a SaaS plan from add-ons. For software companies whose customers actually do construct their own tier from a menu of modules, this format tracks real buying behavior more closely than a fixed set of pre-built packages ever could.
Reading conjoint outputs: what part-worth utilities, importance scores, and willingness-to-pay figures tell a product team
An importance score comes from the spread between an attribute's best and worst part-worths: the wider that range, the more that attribute is driving the choice overall. But importance scores only tell you which lever matters. The part-worths themselves tell you where on that lever the real value sits.
That granularity is where conjoint earns its keep. A survey might report that "integration matters" to customers. Conjoint output shows something sharper: that jumping from no integration to basic integration barely moves the needle, but jumping from basic to enterprise-level integration produces most of the gain. Two features can share a label and behave completely differently in the data.
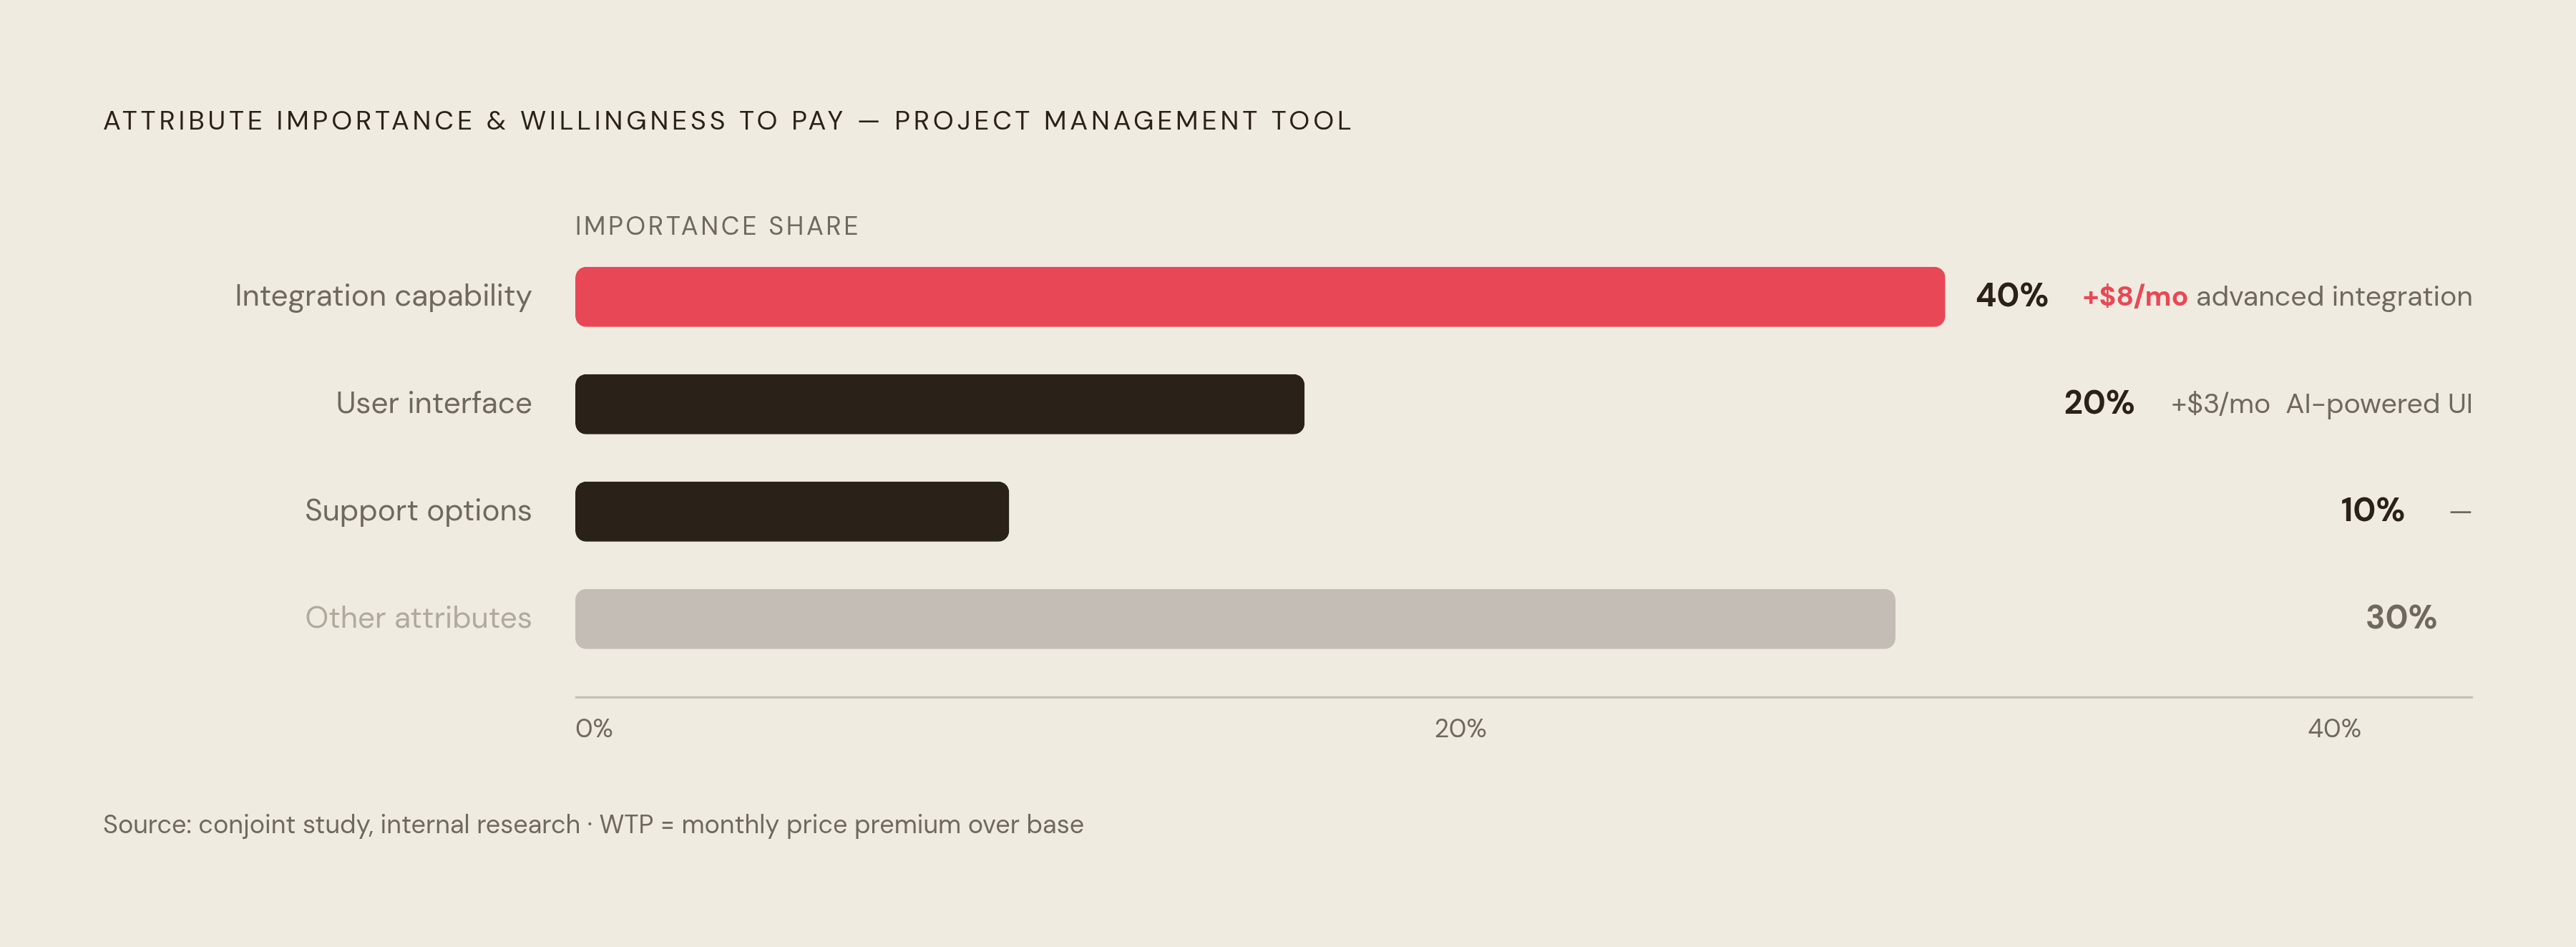
Willingness-to-pay figures come from comparing a feature's utility to the utility tied to a specific price increment in the study design, converting preference into a dollar number a pricing team can actually use. A project management tool tested through this method (documented by GLG) found that integration capability carried 40% of total importance, the user interface carried 20%, and support options carried just 10%. Customers were willing to pay an $8 monthly premium for advanced integration, but only $3 extra for an AI-powered interface, a gap that ran directly against the internal assumption that AI features would command the bigger premium.
Where conjoint fits in the feature prioritization process
Conjoint earns its cost in a specific set of situations. When engineering resources are limited and two or three features are genuinely competing for the next sprint, when nobody internally agrees on how much customers would pay for a given capability, when a new pricing tier or bundle is being built from scratch, or when the product is entering a market where competitors' feature sets shape the buying decision: all of these are conditions where a forced-choice study pays for itself.
It also has clear limits, and pretending otherwise wastes a research budget. Habitual or impulse purchases, gum, bottled water, anything bought on autopilot, involve no active trade-off thinking, so a conjoint study measuring trade-offs there measures nothing real. Features so early-stage or unfamiliar that respondents have no frame of reference for judging them are also a poor fit: conjoint captures reactions to what's shown on the card, not desire for a capability nobody's imagined yet. And once a study pushes past roughly six attributes, the practical ceiling for conjoint design, the quality of the resulting utilities becomes unreliable.
The design itself carries risk that no amount of clever analysis fixes afterward. Leave out an attribute that actually drives the purchase decision, or include one that doesn't reflect how buyers actually think about the category, and the resulting utilities are precise, confident, and wrong. Conjoint models also tend to miss interaction effects, cases where two features together create more (or less) value than the sum of their individual utilities. A security feature might mean little on its own but become non-negotiable the moment a compliance reporting feature sits next to it on the same tier, and a standard conjoint model, taken at face value, can miss that interaction.
Conjoint compared to MaxDiff, Kano, and other prioritization tools product teams already use
MaxDiff asks respondents to pick the most and least appealing item from small sets pulled from a longer list, and it's built for ranking, not bundling. Give it a list of candidate features or marketing messages with no pricing question attached, and it produces a clean, reliable ranking at a lower cost and a lighter cognitive load than a full conjoint study. When budget is the binding constraint and the question is simply "which of these features do people want most," MaxDiff is the more efficient tool.
Conjoint answers a different question: not "which feature wins" but "which package, at what price." A workable two-step process runs MaxDiff first across a long list, say 30 candidate features, to get a dependable ranking, then builds a conjoint study around the top-ranked subset to work out pricing, bundling, and interaction effects. Each method does the job it's actually built for, instead of stretching one tool to cover both questions.
Kano analysis sorts features into categories, must-be requirements, performance features, and delighters, and it's genuinely useful for understanding what kind of value a feature delivers. It has strong face validity and long-standing use in tech product development, even though its scaling approach has drawn criticism over the years. What it doesn't do is put a number on anything: no utility score, no willingness-to-pay figure, just a category label. Conjoint and Kano aren't competing tools; they answer different questions and can run side by side, one telling a team what kind of feature something is, the other telling them how much it's worth.
Gabor-Granger and Van Westendorp both measure price sensitivity, but for one product formulation, or a small handful, at a time. Conjoint's structural edge is scale: it can estimate price sensitivity across a large number of product variants simultaneously, which matters most precisely when the product's design itself hasn't been locked down yet.
Evidence from real deployments on conjoint's impact on feature and pricing decisions
The dog-training app Dogo ran into a familiar problem: the line between its Basic and Premium tiers wasn't landing with users. Some Premium features went unused, others weren't even recognized as premium. Working with the research firm Applica, Dogo ran MaxDiff alongside conjoint analysis to find out which features actually mattered to which user segments and how pricing shaped tier decisions. The result was a 9.5% lift in conversion rate and a 13% lift in average revenue per user, a direct revenue outcome traced back to restructuring tiers around what the conjoint data actually showed, not what the team assumed.
A similar pattern turns up in a broader illustration from the SaaS space: a productivity app ran a conjoint study across 500 users testing pricing tiers, storage limits, collaboration tools, and support levels. Collaboration features carried substantially more weight in the choice data than storage capacity did, so the team rebuilt pricing to put real-time collaboration into the mid-tier plan instead of holding it back for higher tiers. Users turned out to be willing to pay roughly 30% more for real-time collaboration than for an equivalent bump in storage, a finding that ran directly against the internal assumption that storage was the bigger draw.
Enterprise B2B software shows a different kind of signal. In enterprise B2B contexts, conjoint can surface how different buyer segments weight compliance-related capabilities differently, allowing teams to design tiers around distinct buyer priorities rather than a single blended average across every customer type. The pattern points to how far the method has moved from academic marketing research into mainstream product and pricing work.
Running a conjoint study in practice: the decisions that determine whether the output is usable
Everything downstream depends on how the attributes and levels get defined at the start. Picking the wrong attributes, or describing the right ones badly, produces utilities that come out the other end as garbage dressed up as data. Qualitative research beforehand, interviews, open-ended surveys, whatever surfaces what buyers actually weigh, is the recommended starting point precisely because it's the cheapest place to catch a bad assumption.
An SUV study run by Drive Research offers a clean model of how this looks done well: five attributes (size, fuel source, drivetrain platform, towing package, and price), each with levels distinct enough to create a real contrast for the respondent to weigh. Staying at or under six attributes total isn't a stylistic preference; past that point, respondents start ignoring dimensions or falling back on mental shortcuts, and the utilities start reflecting that shortcut behavior instead of genuine preference.
Left unconstrained, a conjoint design will happily generate nonsense cards, a product loaded with every premium feature at the lowest price on the list, something no real seller would ever offer. Prohibited-pair logic, built into the survey programming, blocks those combinations before a respondent ever sees them, keeping the choice tasks believable.
Sample size and task count follow a fairly standard formula for CBC studies: 300 or more respondents, each completing somewhere between 8 and 12 choice tasks, is the typical benchmark, with ACBC able to shrink that requirement somewhat in more complex designs. None of that data becomes useful, though, until it feeds into a market simulator afterward. That's the stage where a team actually tests hypothetical configurations against each other and compares projected preference shares before committing engineering time to anything.
The current software landscape for product teams across different budgets and research maturities
Demand for this kind of tooling keeps climbing. Demand for this kind of tooling keeps climbing, expanding steadily in the years ahead, a trajectory that tracks with platforms built on automated modeling making the method accessible to teams who'd never have hired a statistician for it before.
A comparison of tools published by quantilope in July 2026 lays out the current field. quantilope itself offers Choice-Based Conjoint with a built-in automated market simulator, folded into a 15-method research platform aimed at teams that want conjoint alongside other research methods without juggling separate vendors. It includes an AI research assistant (branded quinn) for automated survey building, live support, and dashboards built for presenting straight to leadership. Pricing starts at $2,000 a month at the Business tier, with conjoint unlocking at the Enterprise tier, and it draws on a global panel network as well as a bring-your-own-sample option, a fit for brands that need both speed and methodological rigor in one place.
Conjointly focuses specifically on pricing and product configuration work, supporting both generic and brand-specific conjoint designs, and it can chain a MaxDiff study directly into a follow-up conjoint built from the MaxDiff results. Its Professional tier runs around $2,900 a year, with an Ultimate tier starting at $10,000 a year, a natural fit for insights teams whose day-to-day work centers on pricing and product conjoint specifically.
Sawtooth Software, through Discover or Lighthouse Studio, remains the legacy standard for highly customized CBC work, built for statisticians and consulting firms that need code-level control over the model. Pricing is available on request rather than posted, and the platform isn't built around modern self-serve workflows, which makes it a better match for academic researchers and technical specialists with the budget and the statistical training to use it fully.
Pollfish, offered through Prodege, rounds out the field as another option in the current landscape, part of a market that's clearly still expanding in both the number of vendors and the range of budgets they serve.